Smart Vulnerable Road User Safety Solutions employ new technologies and connected data and to create a safer environment for Vulnerable Road Users (VRUs) through adopting integrated digital services and data driven processes. Improved safety encourages active travel, unlocking further benefits for improving public health and reducing transport related pollution.
Latest update: 21 April 2023
Vulnerable Road User Safety

Vulnerable Road Users (VRUs) especially pedestrians and cyclists have the highest casualty and fatality rate per mile travelled of all road users. At the same time, uptake of active travel is cited as important in many policies and initiatives to improve public health and achieve net-zero carbon. Driving a strong need to deliver safety improvements for this sector of road users to reduce harm and encourage the use of active travel modes.
Smart Vulnerable Road User Safety includes the use of connected data and technology facilities to create new and improved services that support safer active travel.
For example:
- Improving the quality of travel and route planning services, enabled by data sharing between Authorities and third-party service providers.
- Improving the availability of warning, notification and priority services.
- Improving the physical road facilities to promote safe and convenient travel.
Providing opportunities for Local Authorities by:
- Improving the quality and availability of data to support the planning and design of VRU initiatives and facilities, with less reliance on commissioned surveys.
- Increasing the update of active travel due to improved services and optimised traffic management priorities enabled by the adoption of connected data and technology.
Leading to benefits including lower congestion, lower greenhouse emissions and improved air quality.
The production of this use case was supported by a case study on ‘Smart Systems and Services for Vulnerable Road Users’ written by Newcastle University.
Who are VRUs?
Vulnerable Road Users (VRUs) are road users with comparatively low levels of crash protection and therefore a higher risk of being injured or killed in a road crash and experience higher casualty and fatality rates per mile travelled.
VRUs are traditionally considered to include pedestrians, cyclists, motorcyclists and horse riders. However, with the increase in the use of e-scooters, riders of these devices should also be considered as vulnerable. Within the main groups of VRUs, groups of users with specific characteristics can be identified and their specific needs should be considered such as: those with reduced mobility such as wheelchair or mobility device users or pedestrians pushing prams or accompanied by small children.
The need for Vulnerable Road User Safety
The need to improve VRU safety includes:
- To redress their high casualty rate compared to other types of road users.
- Making active travel safer and more attractive helps deliver initiatives promoting healthy living and carbon reduction.
- As much of the market driven effort in developing technologies and use of connected data are focussed on motor vehicles, the needs of VRUs may be neglected or overlooked.
The adoption of technology and connected data enables traffic authorities and transport operators to build more sustainable, safer and reliable transport networks. This can enhance the safety and comfort of travel of VRUs, including reducing casualty and fatality rates, whilst contributing to physical and mental health benefits and carbon reduction initiatives through the promotion of active travel choices.
Current trends
The value of open data availability and sharing in the field of VRU safety is increasingly being capitalised:
- Oxfordshire County Council provides a platform for cycling data https://oxbike.co.uk/. One of the purposes of this platform is to show how quick and easy it can be to cycle and encourage people to travel by bike or “Park & Pedal”.
- Transport services and products are now available that provide direct services that support VRU safety, or datasets that are useful for planning, performance and safety analysis for VRUs. For example, Wheelmap is a web-based app that allows users to search for, find and identify wheelchair-accessible places.
- The National Parking Platform, utilising the Alliance for Parking Data Standards includes capabilities to identify user accessibility needs as part of the app-based parking services that it enables (see the Parking Management use case).
Traffic infrastructure products coming onto the market recently have capabilities to provide facilities for VRUs and create better datasets for VRU traffic. This includes
- Computer vision traffic sensors (e.g. VIVACITY, Starling technologies)
- The latest versions of TRL’s SCOOT adaptive traffic signal network control system now include “green man” pedestrian optimisation, originally trialled in London
The availability and capability of active safety features incorporated into motor vehicles continue to develop. For example, enabled by improved radar/camera/ Lidar sensors; software/computing development and new standards the latest Autonomous Emergency Braking (AEB) systems are able to react to protect vulnerable road users. In-vehicle technology, including the use of cameras to provide drivers with a view of blind spot areas, is being used to tackle the lack of visibility of VRUs such as cyclists to drivers of larger commercial vehicles is a leading cause of accidents. HGVs registered since 1 November 2015 are required to be fitted with AEB. However, earlier AEB systems only detect motor vehicles, only newer AEB systems are designed to react to cyclists and pedestrians and Pedestrian AEB is now available on the market and may become a compulsory requirement in the future.
The consortium developing C-ITS defined a set of use-case and service specifications to protect vulnerable road users using cooperative communication between road users and infrastructure. Projects such as VRUITS have developed and field-tested the direct application of technology based on these C-ITS services, although most of these products and services are not yet ready for market. However, Copenhagen has implemented C-ITS services on a large scale for cyclists including a Green Light Optimal Speed Advisory service, which is available for cyclists through the GreenCatch mobile app.
Micromobility services have developed rapidly, including dockless bike-share hire services and currently trials of e-scooter rental services are taking place throughout England. Innovations in micromobility are beneficial for promoting low impact and active mobility, for example by providing flexible first and last mile transport. However, these may be less accessible for users with reduced mobility and there are safety concerns associated with some micromobility developments – including the use of e-scooters, around their interactions and impacts on other road users such as pedestrians and motor vehicles.
Travel planning services increasingly use data connectivity to facilitate multi-modal travel and provide first and last-mile connectivity for example Google maps provides options for using local micromobility services (see the MaaS use case).
See.Sense provides bicycle lights and tracker products with GNSS/sensor telemetry capabilities collect data from their users with attributes that include: location/time, high frequency accelerometer, and cycle survey reports. The ROSPA Cycle Smart Brum report provides an example of applying this data to understand reported and unreported cycling collisions and See.Sense have developed analysis techniques covering a variety of insights:
- Data supporting the design of optimal cycling networks:
- Popular routes/speeds, dwell time and congestion, pedestrian conflict areas.
- Safety analysis:
- Swerving and braking data collates with Stats 19 collision data but identifies where near-miss incidents occur providing a leading indicator of risky areas for cyclists.
- Pavement surface conditions:
- Mapping of pavement unevenness builds an understanding of where repairs are needed to manage comfort and safety for cyclists.
- Evidence cycle infrastructure performance:
- Data can provide before and after comparisons to understand the impact of changes.
- Understanding diverse needs:
- Anonymised profile data including age and gender allows analysis of differences in experiences.
- Collection of user survey data that provides a detailed understanding of user perceptions, experiences and requests.
The Strava fitness app platform provides a dataset called Metro to relevant bodies with the intention of helping to make human-powered travel more efficient, safer and accessible. This dataset can help the effective planning and prioritisation of interventions through, for example, identify high risk routes and helping to evaluate the impact of proposals. Devon County Council made use of this dataset to prioritise repairs on more popular cycling roads.
High-level objectives
The adoption of smart vulnerable road user safety provides opportunities for Authorities to increase the uptake of active travel through the following approaches:
- Subscribing to and use of third party VRU datasets:
- See.Sense covers a wide range of metrics including pavement surface condition, hazard areas, and cycle volumes/speeds.
- Strava Metro dataset supports the effective planning and prioritisation of interventions.
- Publishing VRU support data for use by third-party VRU services:
- Accessibility: The National Parking Platform and/or the Alliance for Parking Data Standards enable app-based parking services that include capabilities to advise on user accessibility needs.
- Publishing data on quiet/safe routes to open platforms such as OpenStreetMap improves the quality of route planners such as Cyclestreets.
- Enabling connected data and C-ITS services for VRUs:
- Copenhagen have implemented C-ITS services, providing cyclists with warning/advisory information and priority services that are delivered through a combination of cellular and direct wireless communications.
- Promoting the adoption of VRU protection technology in vehicles:
- Partnerships and contracts: Ealing Council arranged for all large vehicles used for their refuse collection and highway works contracts to be fitted with pedestrian AEB systems. Trial results showed potentially serious collisions with cyclists were avoided and savings from reduced fuel consumption were achieved.
- Controls and enforcement: The TfL Direct Vision Standard and HGV Safety Permit scheme enforces against HGVs with poor direct vision of VRUs and blind spots to be fitted with equipment to provide indirect vision, including camera monitoring systems and sensor systems with driver alerts.
Supported policies and duties
The adoption of Smart Vulnerable Road User Safety supports the achievement of the following policies and duties:
- The Gear Change and Future of Urban Mobility Strategy recognise the need to make cycling and walking the natural first choice for many journeys and to support this by improving safety.
- The Government’s National Infrastructure Strategy and the DfT’s Transport Decarbonisation Plan discuss decarbonisation through policies which includes promoting active and sustainable travel.
- The UK Government’s National Data Strategy sets out an action plan which includes the mission of transforming the Government’s use of data to drive efficiency and improve public services. The UK Innovation Strategy sets out the Government’s ambition for the UK to be a global hub for innovation with the world’s best innovation ecosystem. This includes:
- Continual adoption of new products and technologies.
- Capitalising on data – creating an environment where data is usable, accessible and available.
- Designing successful innovation – by putting the needs, wishes and behaviours of people at the heart of the innovation process.
- Supporting active travel may support network management duties placed on local traffic authorities by the Traffic Management Act 2004 to secure more efficient use of their road network, expeditious movement of traffic and avoid/eliminate congestion.
- Digital services for VRU that ease access and provide better information for accessibility help to improve monitoring and satisfaction of duties placed on the Authority by the Equality Act 2010 and/or Disability Discrimination Act 2005.
- Supporting VRU safety through the adoption of technology and use of connected data may support the Authority’s policies including promoting active/sustainable travel, tackling climate change, addressing inequalities or delivering improved customer services.
Qualitative Benefits
Smart Vulnerable Road User Safety can provide the following qualitative benefits:
- Improved datasets for planning and evaluating VRU interventions.
- Improved data for planning and design processes.
- Ability to provide a clearer justification for proposals and demonstrate before and after impacts.
- Improved availability and access to VRU services and information
- Making data digitally available to users, either directly or via third parties improves services for users.
- Helping users discover available facilities, make more informed choices for safer or better routes, and can be used to encourage more sustainable, or active, travel choices.
- Improving users’ access to services and information; provides an overall improvement in customer experience.
- Publishing datasets for use by third-party services improve the range and quality of services available.
- Improved advisory and warning information for VRUs
- Improved detection and optimised signal priority for VRUs
- C-ITS enables GLOSA and Green Light priority for VRUs.
- The use of connected data and intelligent sensors enables enhanced priority/optimisation through improved availability and fidelity of VRU data for traffic control. Provides opportunities to improve the effectiveness of signal control and prioritisation, and improve road user behaviour.
Quantitative Benefits
Smart Vulnerable Road User Safety can support the following quantitative benefits:
- Reduced road casualties
- Particularly of VRUs
- Improved public health
- Increased uptake in healthy active travel
- Improved air quality
- Improved uptake of active travel modes
- Supports public health, air quality, and carbon net-zero.
- Smoothed traffic flow, reduced fuel use and emissions
- Achieved through increased uptake in active mobility and improved road user behaviour. For example, the trial of a pedestrian AEB system in Ealing demonstrated fuel savings.
- Reduced expenditure
- Reduced need for manual surveys and more efficient spending based on data driven decisions.
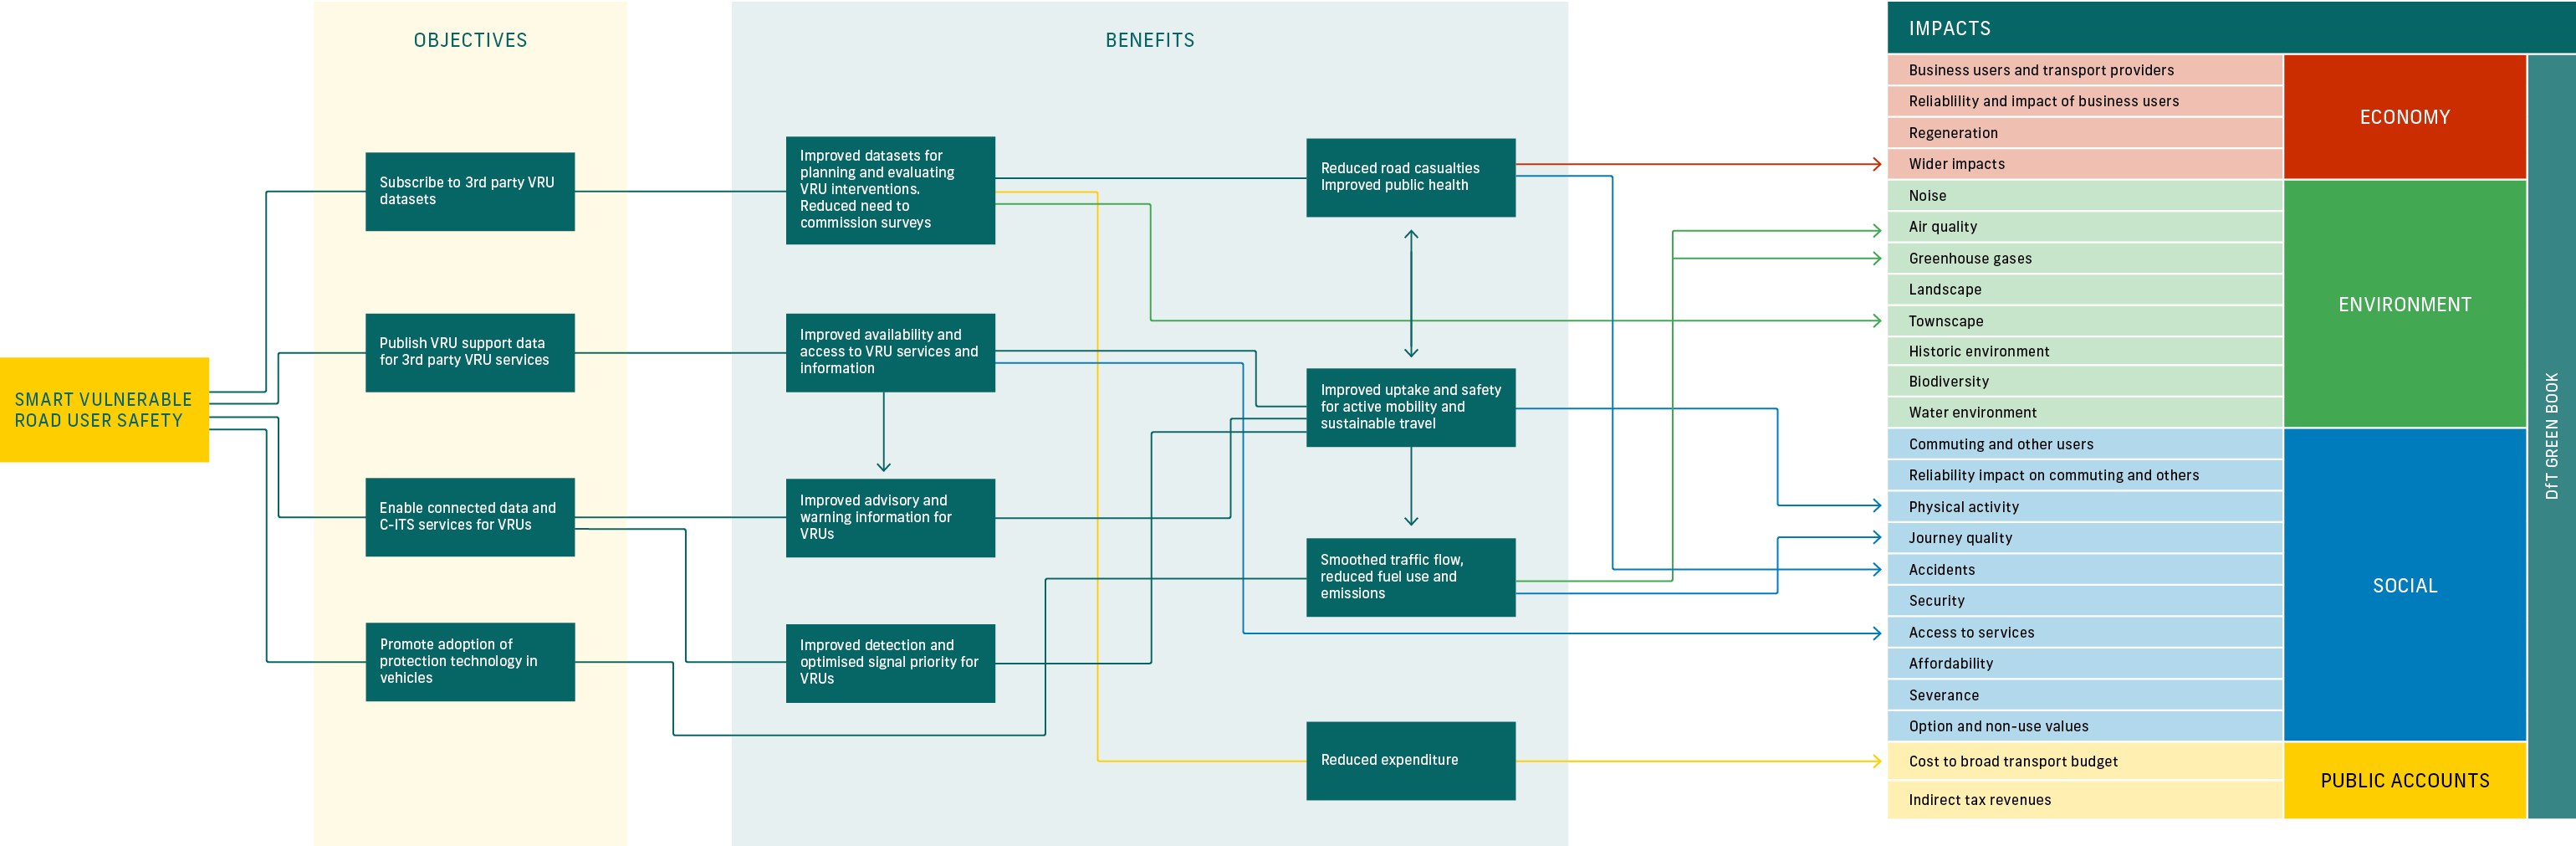
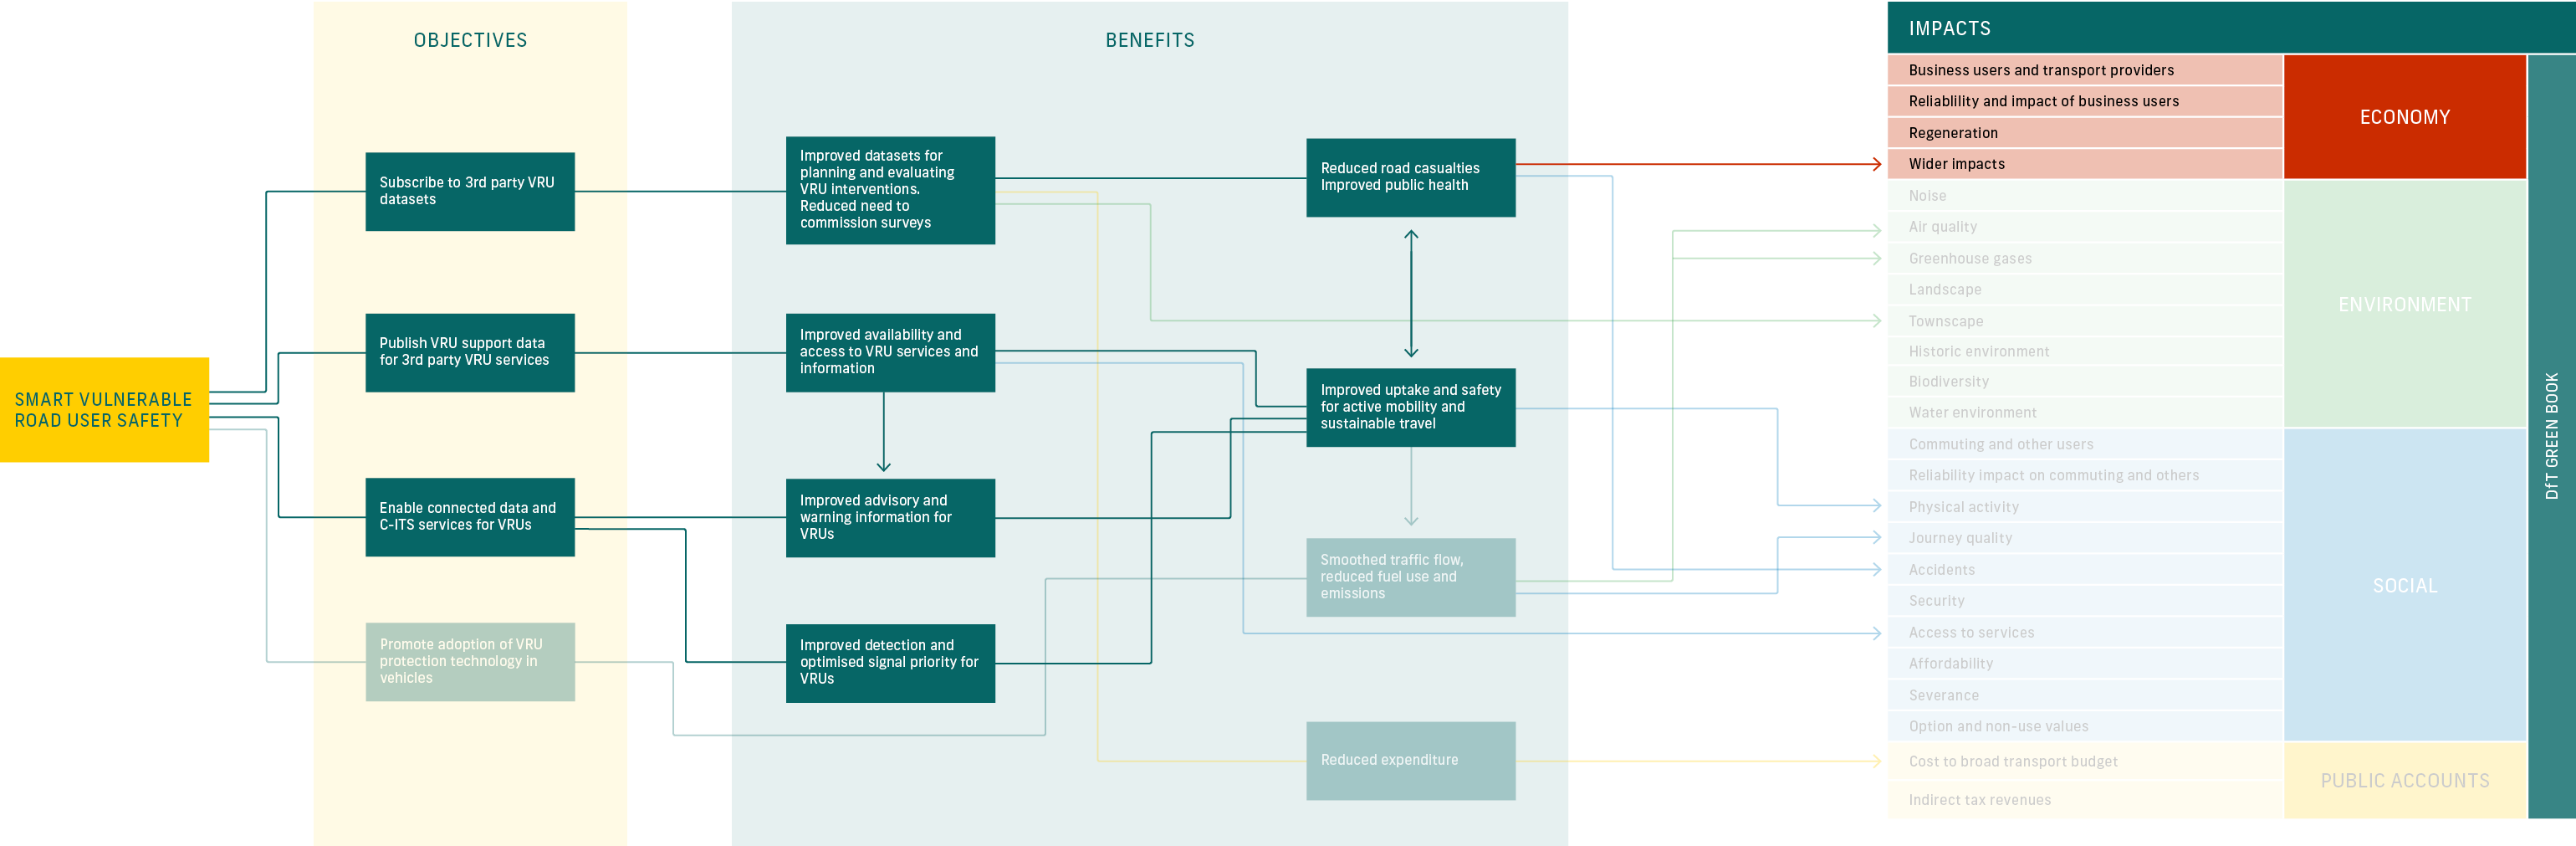
The potential impacts of smart vulnerable road user safety systems are illustrated by the logic map shown in Figure 1 below.
View by impact type:


DRAG
Introduction
This section intends to support the development of plans and specifications by providing the following information:
- Actors: who need to be considered in the development of the system.
- Architecture and Data flows: showing how administrators and users interact and use the system, to help identify and develop the needs and specifications of the system.
- Standards: that are important and how these are used in the context of this use case.
- Possible future developments: in practices and technology that may provide opportunities in the future.
Actors
The service design is functionally described by the interaction between the service and the actors (any user or system that interacts with the service).
The following actors need to be considered in the development of the service design:
- Vulnerable Road Users: road users who have a comparatively low level of crash protection or other characteristics making them more vulnerable to harm in a collision.
- Other Road Users: road users who interact with VRUs or may be impacted by VRU services.
- Authority: body responsible for providing/maintaining road facilities and services and may shape these to enhance Vulnerable Road User Safety
- Third-Party providers: third parties who provide digital services to vulnerable road users. They may also support Authorities in implementing and operating services through the supply of products and/or services.
Architecture and Data Flows
For the purpose of the information and diagram presented in this section, the vulnerable road user journey is considered as a single idealised journey.
The data flows are illustrated in Figure 2 – Idealised Vulnerable Road User journey and Figure 4 – Idealised Manager’s activities.
The data requirements and data flows are tabulated in Figure 3 – Data Requirements for VRU and Figure 5 – Data Requirements for Idealised Manager Activities.
Figure 3 – Data Requirements for idealised Vulnerable Road User


Start
Plan Journey
Execute Journey
Signal Services
Understand
Report

What the user needs
- As a user, I need to know the best options for a safe and convenient journey based on attributes and preferences such as travel mode accessibility needs, and traffic attributes such as time of day, expected traffic, planned events or road works so that I can make an informed decision for the option I choose.
- As a user, I need to be updated on real-time factors affecting my journey such as traffic incidents or congestion. So that I can start my journey and decide whether changes that require re-routing in order to travel safely and arrive in a timely manner.
- As a user, I need traffic signals to optimise my journey. I benefit from advisory and priority services at signals for my journey.
- As a user, I need to know what facilities and services are available to me, and the level of service expected.
- As a user, I need to be able to report issues, know the processes to do so, and be notified on decisions and updated on response to reported issues.
What the system needs from the user
- Start location and end destination
- Travel mode
- Accessibility needs
- User specific preferences and needs.
- User location and planned route.
- Travel mode
- User location and speed
- Language / Accessibility requirements
- Location or Topic
- User location and or location of interest
- Type of issue / asset involved / site reference number.
- Photographic evidence
- Description of issue
- Whether the issue is safety critical
- Date / time
- Contact details and preferences
Data requirements
- Location for journey start / end destination
- Historic journey times
- Permitted routes
- Planned events/roadworks
- Real-time traffic data (e.g., speeds)
- Traffic events/incidents/route restrictions
- Current user location and route
- Estimated travel time
- Co-operative awareness (CAM)
- Positioning and Timing (POTI)
- Signal phase and timing (SPAT)
- Topology (MAP)
- Language / Accessibility information
- User preferences (profile)
- Location or topic
- Levels of service descriptions
- Service usage descriptions Duration of stay
- Location / area of interest
- Date / time
- Contact details
- Contact preferences
- Fault logs
DRAG
Figure 5 – Data Requirements for Idealised Manager’s Activities


Start
Monitor and maintain physical assets
Plan & Design interventions for VRU
Manage data for VRU services
Accounting, reporting and support activities
What the manager needs
- Inventory of Assets
- Asset condition
- Known site issues/conflict areas
- Collision/Safety data
- Routes/speeds
- Data collection
- A database to manage data and standards for data formats
- What data is available to what groups of users.
- Products/specification for data sharing and communication
- To know how long to retain different types of data
- Have the ability to review, validate and address customers’ complaints
- Reports on VRU numbers and performanc
What the system needs from the manager
- Performance measures and targets
- Budgets and costs
- Evaluation criteria
- Data retention configuration
- Data formats
- User account control
- Response times
- Report formats
Data requirements
- Asset & condition inventory
- Works records
- Accounts and reports
- Flow / speed / dwell / user types of metrics
- Hazard locations / collision data
- User reports / issues
- Geographic: Routes, Facilities, accessibility
- Warning: Roadworks, Hazards
- Advisory: Signal phase
- Payment system performance
- Information from enforcement management
- User transaction data
- User contact details
DRAG
Interfaces
Interfaces between systems and services depend on the specific design and the boundaries with other systems and services.
The general principle is that interfaces should be specified to use standardised data flows and protocols wherever standards are available, as following standards will support the integration of other systems and services
Standards and Specifications
It is important to align with and/or support the development of National Standards:
- To ensure the digitalised services consumed by customers are Authority agnostic and do not require different apps/services for every different town and city.
- To ensure the services can interface with recognised customer-facing accounts e.g., Google, Apple, OEM -based services.
Under the European ‘Co-operative Intelligent Transport Systems (C-ITS) programme a range of standards has been produced and continues to be developed. C-ITS services are based on the concept of data exchange between vehicles, roadside infrastructure, control and service centres and other road users and guidelines on their use published by ISO and CEN. These give consideration for vulnerable road user protection, including defining a set of use-case for VRU awareness. Projects such as VRUITS and CO-UMP Copenhagen have trialled or deployed VRU services based on these specifications. The implementation of these standards is not yet widespread, however, there are several products, relevant for VRUs and based on C-ITS platform standards, that are at, or near to, market and following rollout may become more widespread in the near future.
Services for travel information and mobility services help enable VRU trips, in particular supporting first and last mile travel.
- For travel information: DATEX II (CEN/TS 16157) is a multi-part set of international data content and framework standards for road transport and traffic telematics.
- The Bus Open Data Service (BODS), which provides a national platform for bus data, including timetables and ticketing based on several standards, including parts of DATEX II.
For mobility services, several relevant standards have been published or are in development, for example, the Los Angeles Mobility Data Specification. However, this remains a relatively immature area and there is not yet a clear consensus on how standards will be adopted at scale. There is a crossover with Mobility as a Service, for which standards are discussed in the MaaS use Case.
Standards for Parking Services may interface with VRUs for example by including accessibility attributes as part of parking place information. The Alliance for Parking Data Standards is particularly relevant, standards for parking are discussed in the Parking Management use Case.
Possible Future Developments
Mobility services are actively developing and these services influence the share of trips involving VRU modes – in particular where these services become more integrated or offer micro-mobility options. Third-party mobility applications are more likely to offer more services for active travel in areas where Authorities promote active mobility data. E-scooter rental schemes are being trialled in several locations and it remains to be seen how this will develop in the future and whether private e-scooter ownership will be legalised.
Active safety systems incorporated into motor vehicles will become more effective at protecting VRUs. For example, the PROSPECT project developed and demonstrated next generation of VRU safety systems and these are forecast to be brought to the mass market in 2025 and deliver substantial reductions in VRU injuries and deaths. Future regulations may require new vehicles to have safety features fitted or even retrofitted to existing vehicles where there is a particular safety need in a similar way to TfL’s ‘direct vision’ scheme that regulated the visibility requirements for HGV drivers in London.
The proposed C-ITS platform has defined several services that offer safety and performance improvements for VRUs, however, their use remains relatively small. Some services, such as warning drivers of nearby VRUs, do not require roadside infrastructure as they are ‘V2V’ using only direct communications between vehicles and devices carried by VRUs. However, it may take many years before a significant number of vehicles adopt these services and this may require regulation. ‘I2V’ services provided by communications between infrastructure and mobile devices can be rolled out more quickly and have been implemented in places such as Copenhagen, however, this requires significant Authority commitment to install and maintain the infrastructure. Furthermore, they require support from the market to develop and provide the applications that provide the service interfaces. In future, more products may come to market providing services for VRU based on C-ITS for example Spoke claims to be developing a platform that will provide secure, direct communication for contextual awareness and alerts between drivers and cyclists, enhancing safety for VRUs.